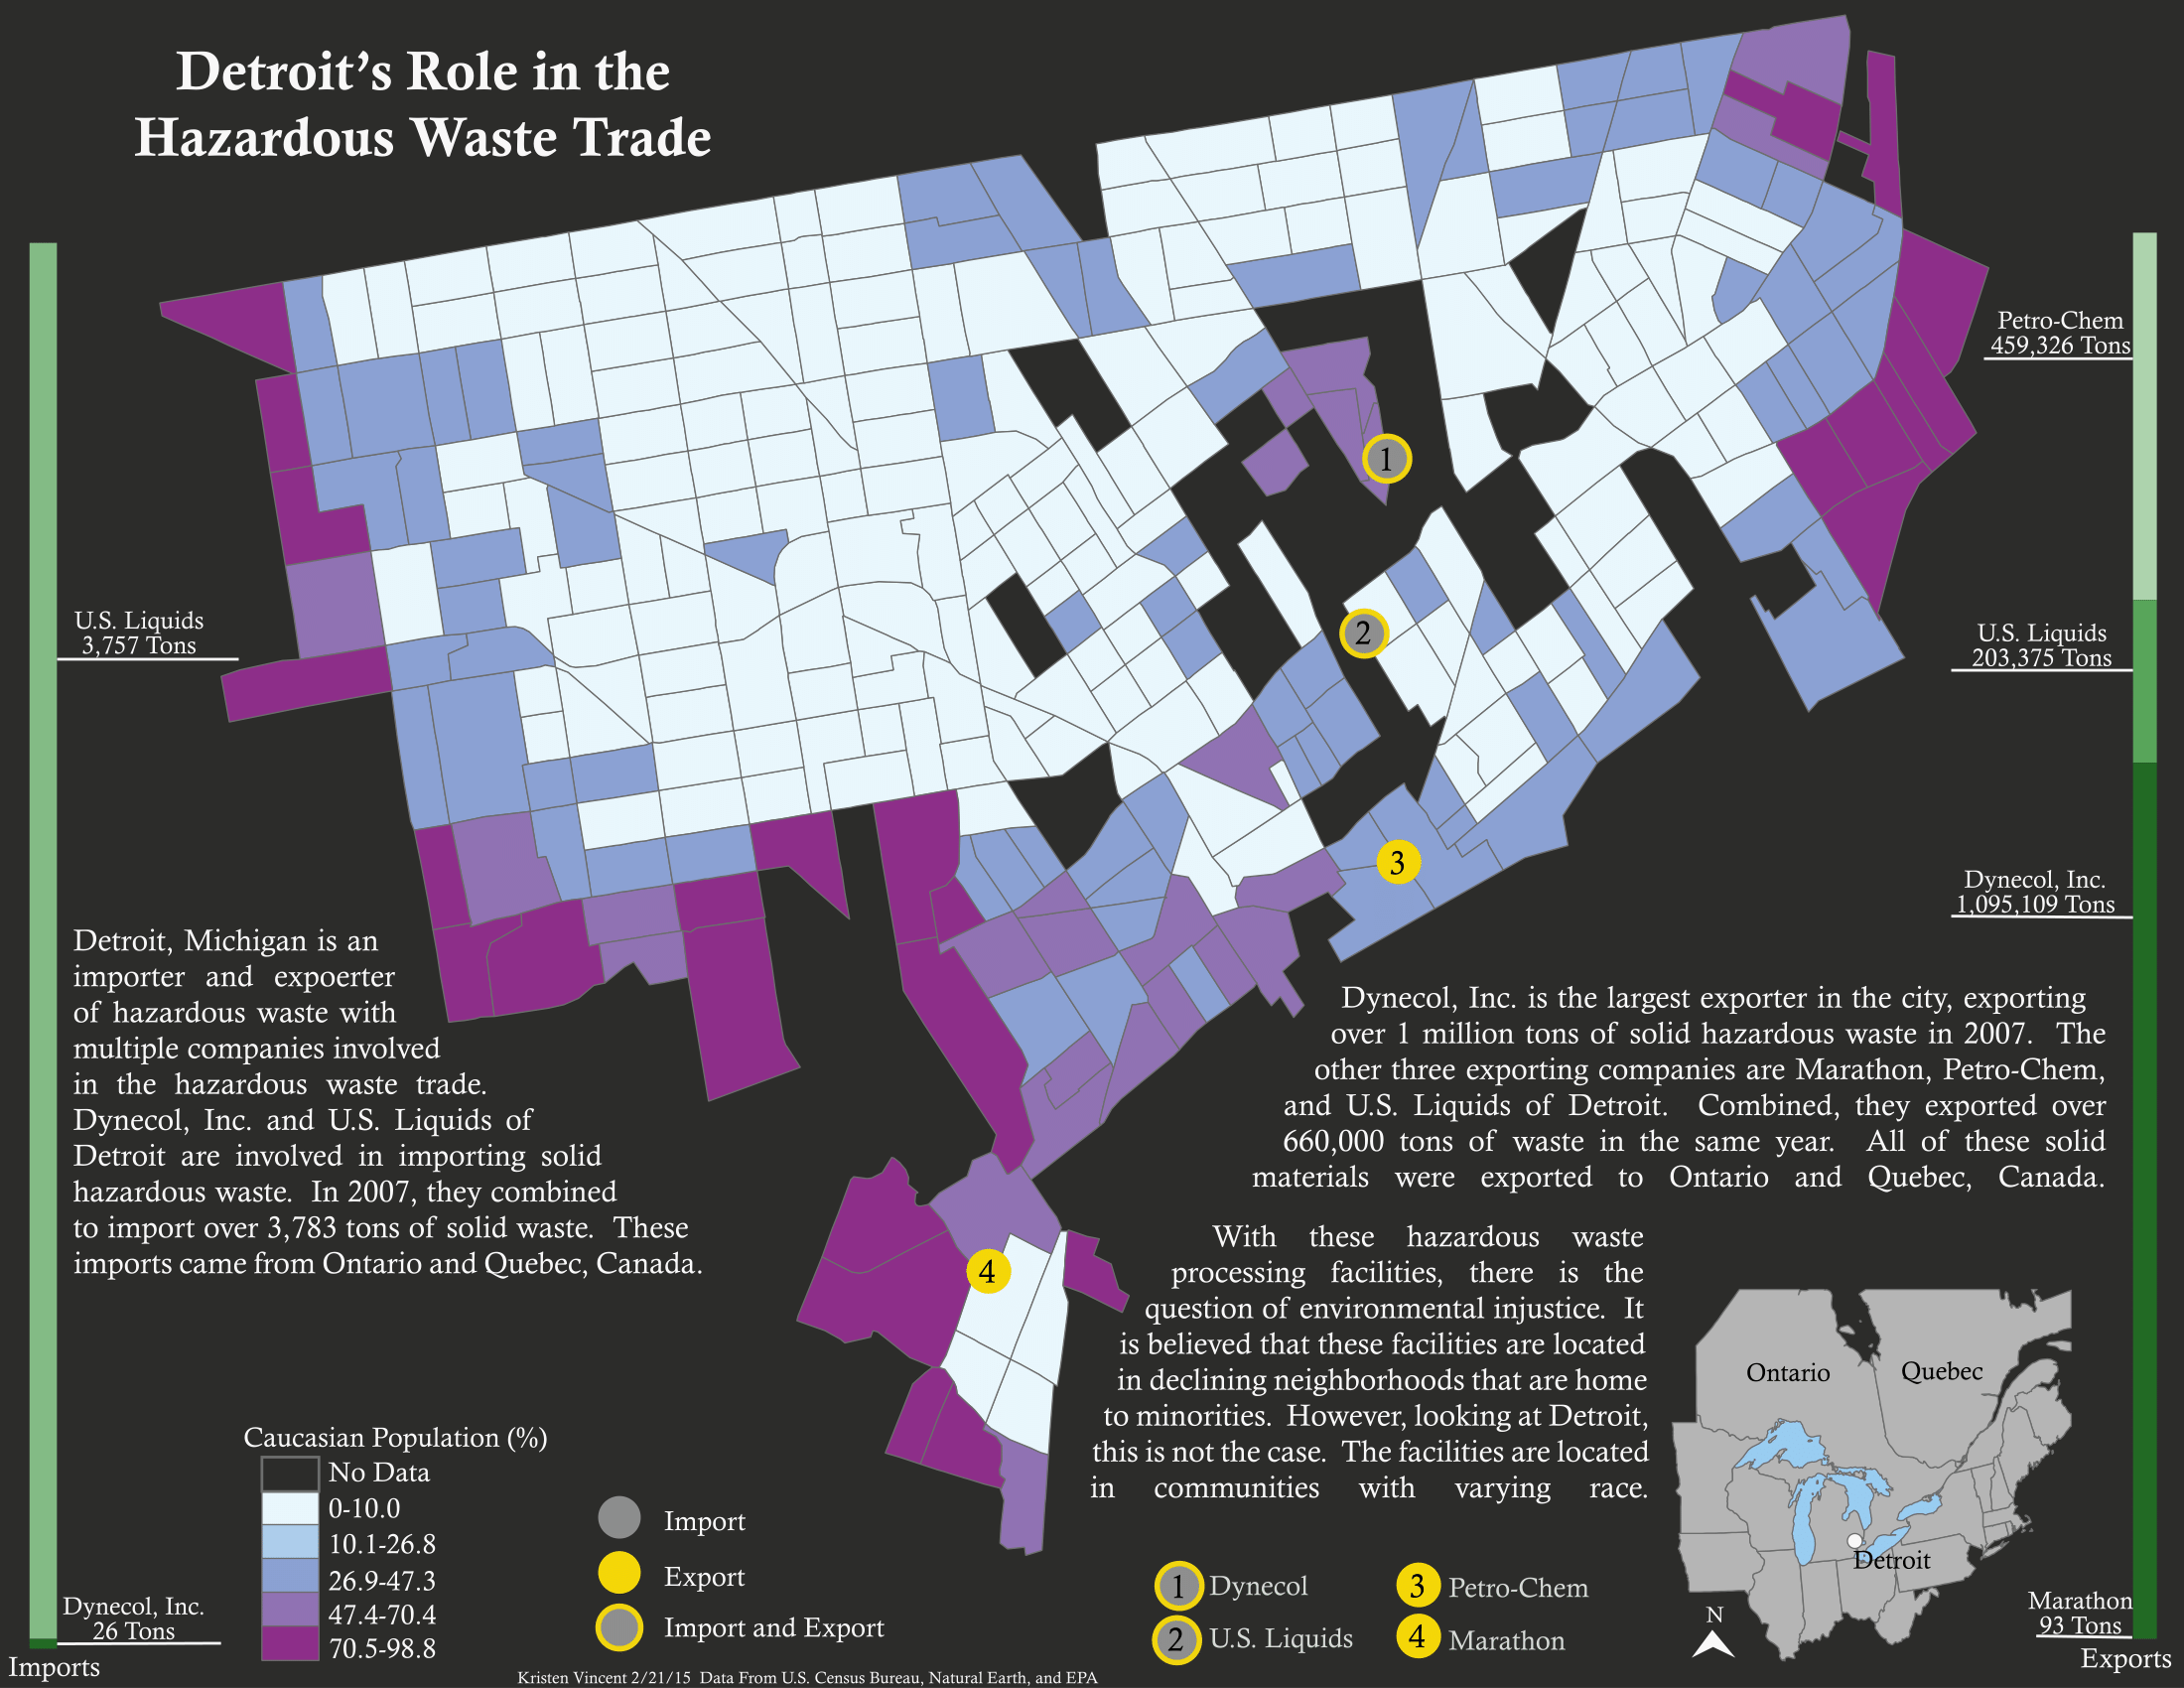
During my time in the GIS Certificate Program and Graduate School at the University of Wisconsin-Madison, I had the opportunity to participate in several Design Challenges. Here, we spent one entire day creating maps and visuals on a topic of choice, developed from a given dataset. The first map shown below, was from the first Design Challenge. The dataset we were given was on the North American hazardous waste trade. This Challenge was intended to give the research group added insights into what stories are in this massive dataset (I later became a member of this research group). This map shows importing and exporting facilities for Detroit, Michigan. Percent caucasian was shown as a choropleth map, creating a classic Environmental Justice correlation.
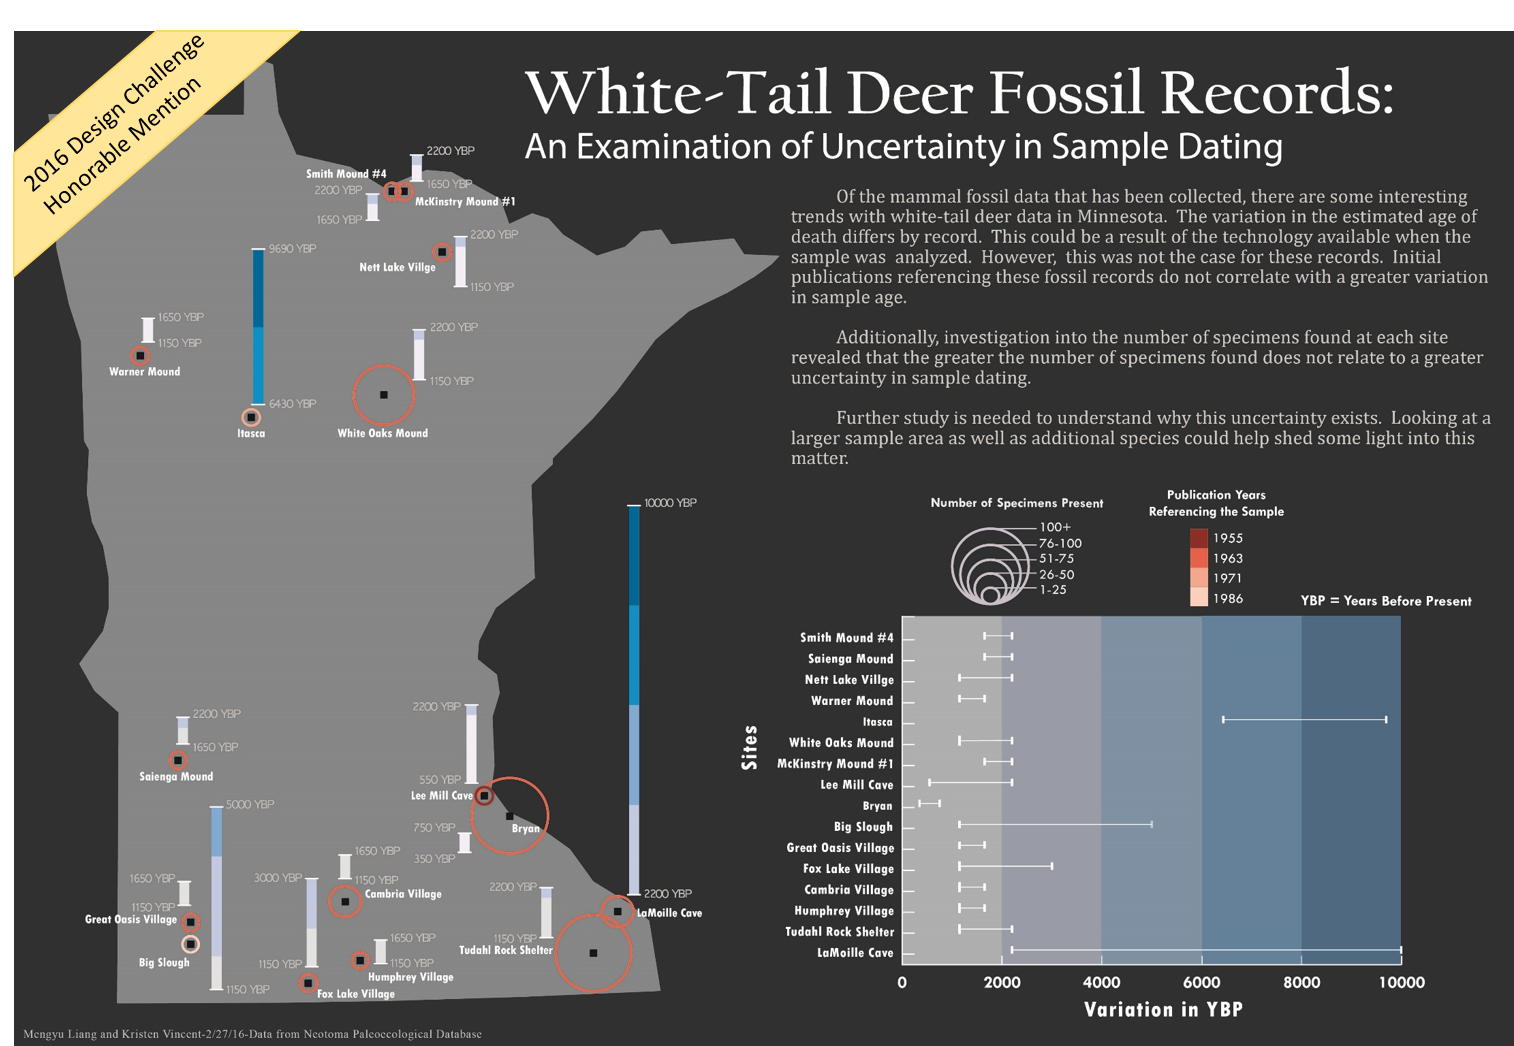
This next map is from the second Design Challenge. For this Challenge I worked with a partner for the day. We worked with a spatio-temporal fossil record dataset. Our map looks at white-tail deer fossil records in Minnesota. We visualized the number of specimens present at each dig site, publication dates showing when samples were collected, and variation in estimated age of death. The goal was to determine if older samples had greater variation in reported time of death because of the limited technology available. This was not the case and further investigation is needed. We were awarded Honorable Mention for our work.