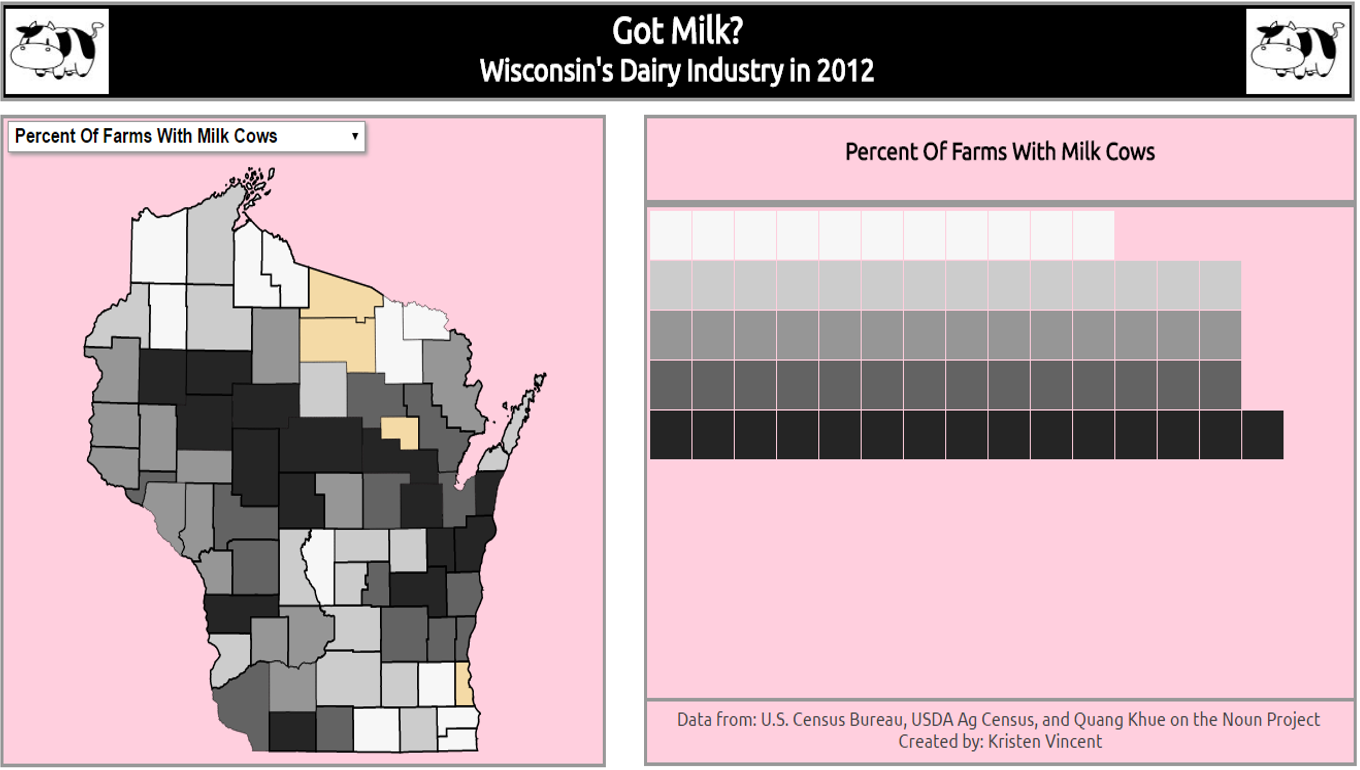
I made this map for my Interactive Cartography and Geovisualization class. This map examines Wisconsin's dairy industry in 2012 by letting the user explore cow production and the amount of dairy farms by county. I made this map using the D3.js library; this was my first experience using this library, and I was satisfied with my final product. Scroll down to see a video of the map in use. Click on the image to go to the full interactive map.