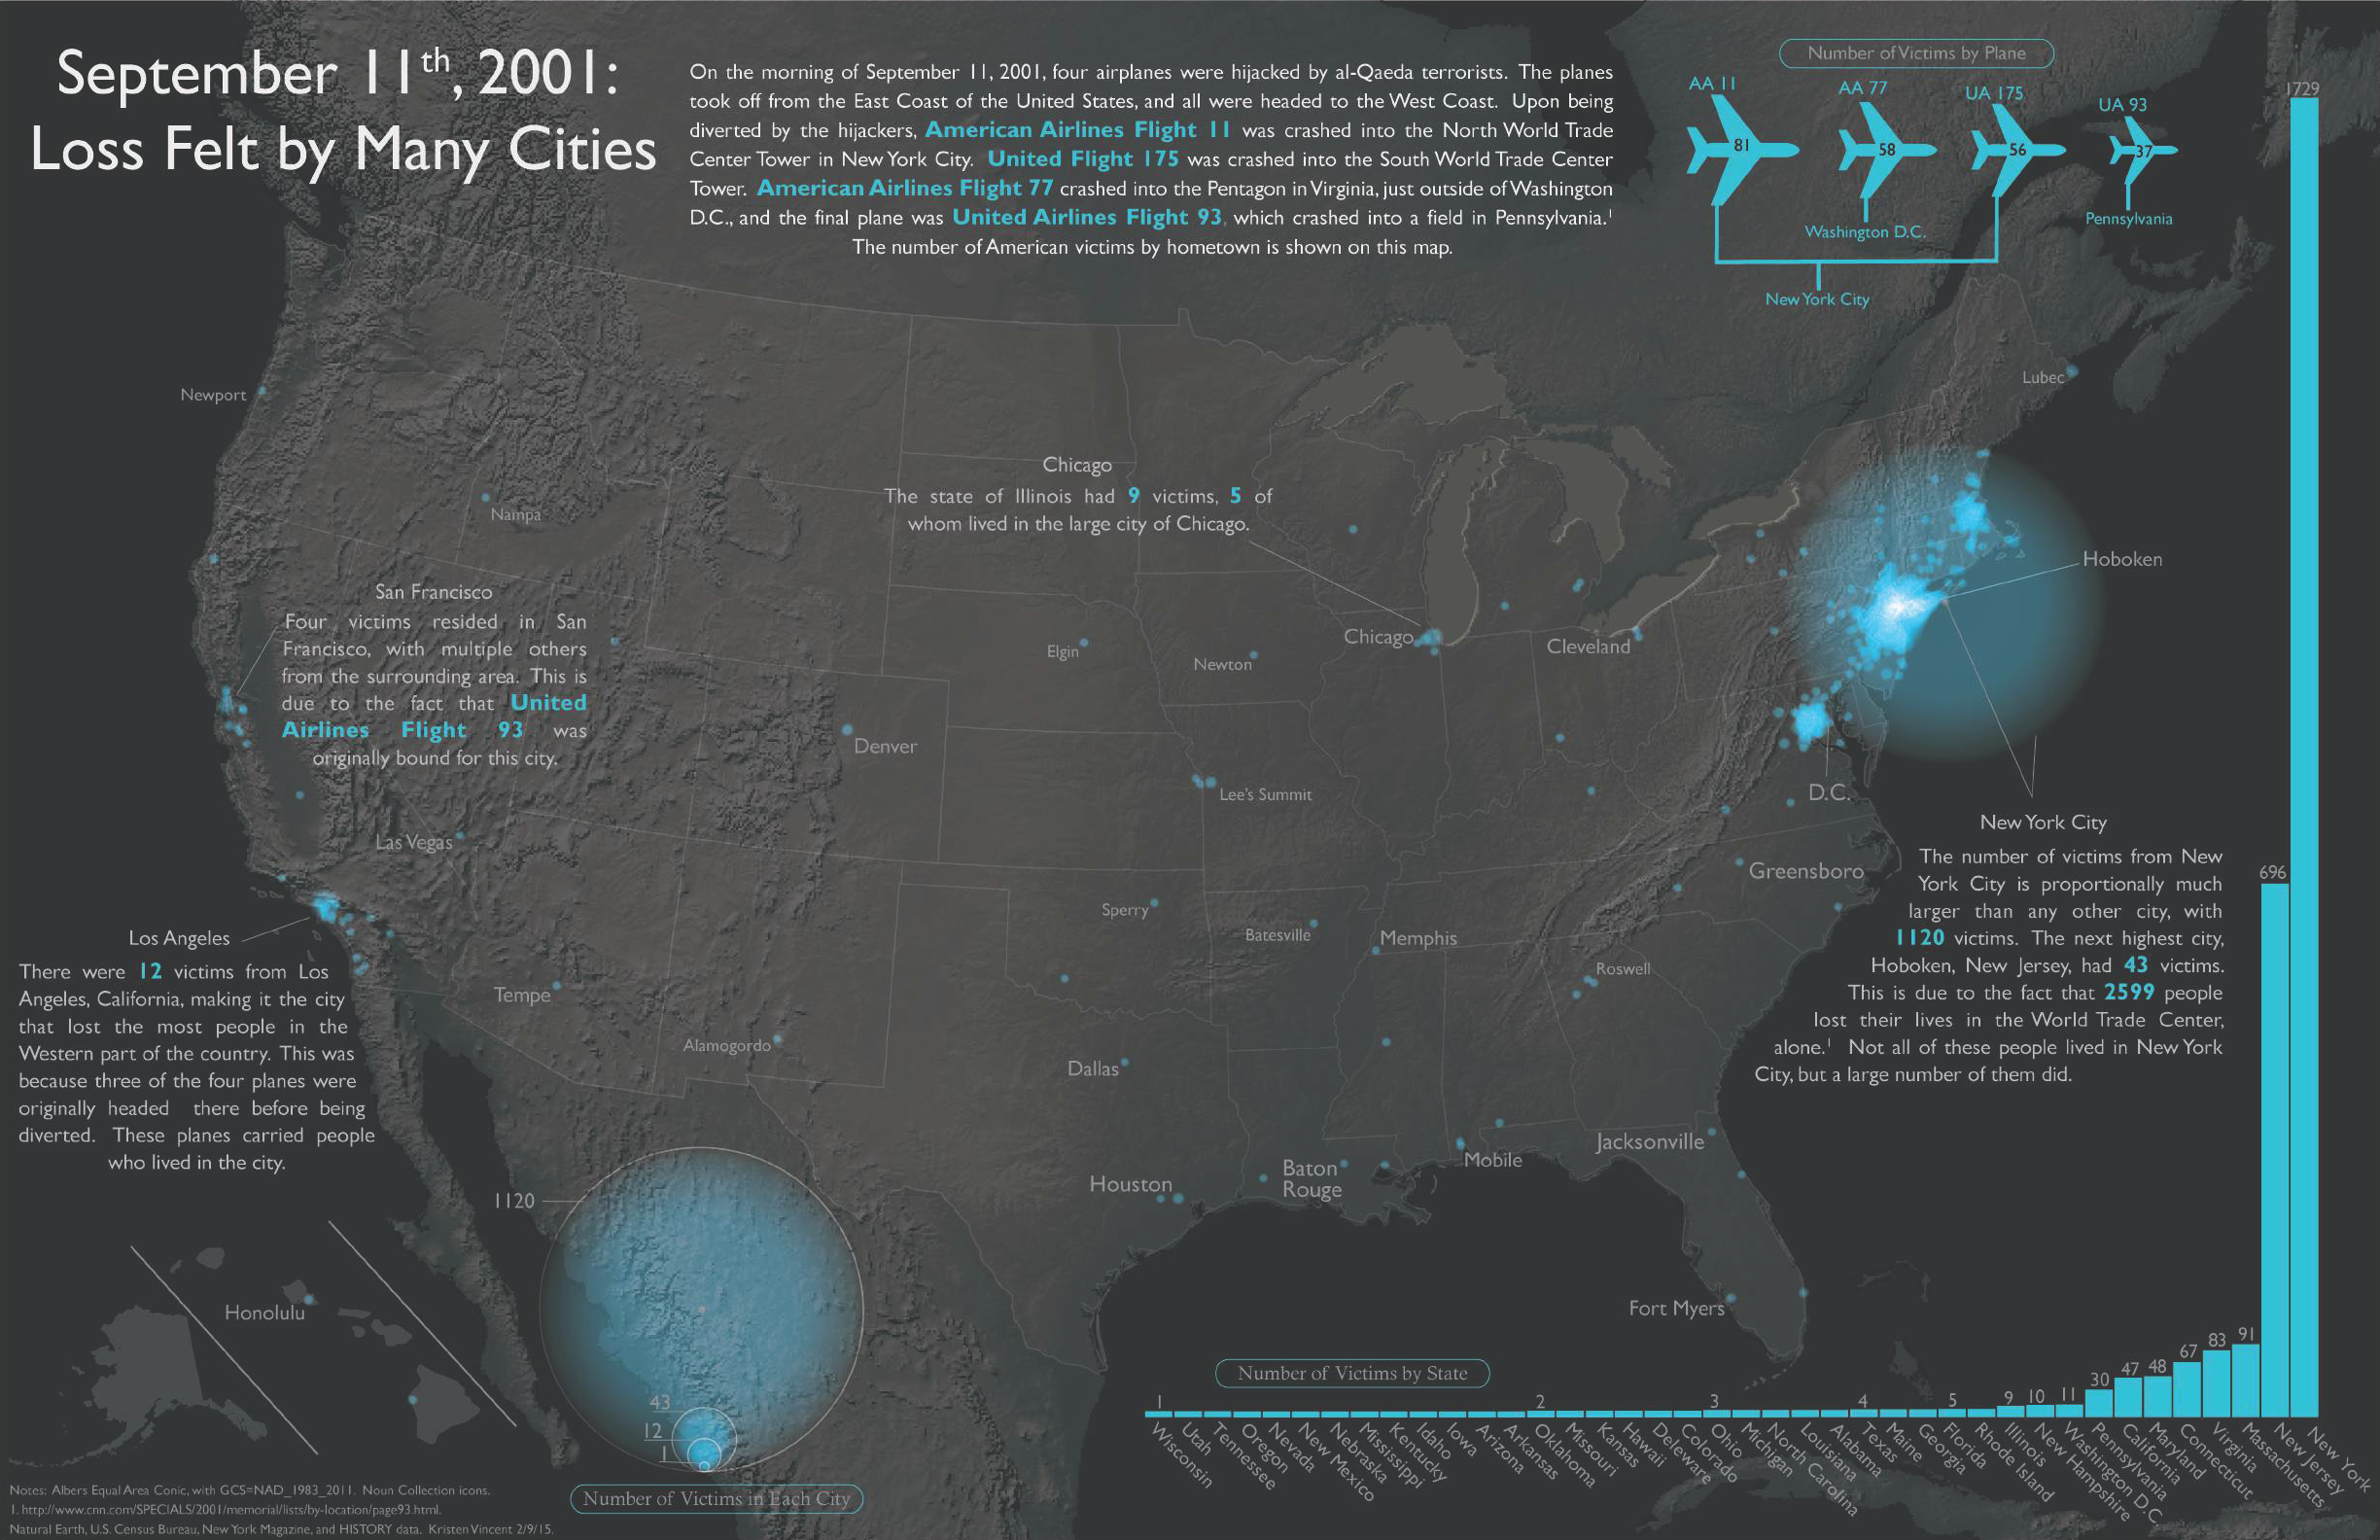
This map shows where the American victims of the terrorist attacks of September 11th, 2001 lived. The number of people is shown proportionally by city since there were many cities that were home to multiple victims. This map was created using data from a CNN data table and Natural Earth data for the background. The table consisted of the victims’ names, where they lived, where they worked, and where they lost their lives. The designing was completed in Adobe Illustrator. A transparency and radial gradient were applied to the proportional symbols to achieve the “spotlight” effect where the greater density of cities rose to the top of the visual hierarchy. This effect can be especially seen on the East Coast because there was a lot of city overlap since that is where the attacks took place. The effect was enhanced with the use of a textured background. The added dimension allows for the proportional symbols to be more visible on the map.